The goal of the project was to apply the USDA Forest Service’s Tree Canopy (TC) Assessment Protocols to Cuyahoga County.
The analysis was conducted based primarily on 2011 infrared imagery from the National Agricultural Inventory Program (NAIP), together with a number of local data sources. The project was made possible by funding from a US Forest Service grant administered by the Ohio Department of Natural Resources, Division of Forestry, with support from the Cuyahoga River Community Planning Organization. Funding was matched by equal in-kind contributions from the Cuyahoga County Planning Commission and Cleveland Metroparks, as well as a number of individual communities. Land cover analysis was conducted by the Spatial Analysis Laboratory at the University of Vermont’s Rubenstein School of the Environment and Natural Resources in collaboration with SavATree, Inc. Tree canopy metrics were developed by the Cuyahoga County Planning Commission and Cleveland Metroparks.
Mapping Cuyahoga County’s Trees
Prior to this study, the only comprehensive remotely-sensed estimates of tree canopy for Cuyahoga County were from the 2006 National Land Cover Database (NLCD 2006). While NLCD 2006 is valuable for analyzing land cover at the regional level, it is derived from relatively coarse, 30-meter resolution satellite imagery (Figure 3a).
The NLCD substantially underestimated Cuyahoga County’s tree canopy, at 17.6%, largely because it failed to capture smaller patches.
Instead, using advanced automated processing techniques to combine high resolution aerial imagery (Figure 3b), with a variety of locally developed sources to develop land cover mapping for the entire county in much greater detail (Figure 3c).
Data sources include:
- Leaf-on 4-band aerial imagery, 1 meter resolution (USDA National Agricultural Imagery Program, 2011)
- Leaf-off 3-band color infrared aerial imagery, 1 foot resolution (Cuyahoga County, 2011)
- LiDAR point cloud (Cuyahoga County, 2006)
- Building polygons (Cuyahoga County, 2006 and City of Cleveland, 2008)
- Road polygons (Cuyahoga County, 2006)
- Property parcel polygons (Cuyahoga County, 2013)
- Hydrography polygons (Cuyahoga County, 2006)
- Impervious surface polygons (NEORSD, 2012)
Figures
Comparison of NLCD to high-resolution land cover: (Figures 3a-3c)


Geographic Area Metrics
After land cover was mapped county-wide, Tree Canopy (TC) metrics were summarized for a number of geographic scales. Existing TC and Possible TC metrics were calculated for Communities, Watersheds, Riparian Zones, Census Tracts and Blocks, and individual parcels. Metrics were calculated both in terms of total acres and as a percentage of the land area within each parcel (TC area ÷ land area of the parcel). See Figures 4a–4d for a graphic view of parcel level summarization.
In addition to those calculated metrics, any characteristics of those areas can be applied to the analysis. Population demographics, for example, can be tied to the metrics for census geographies. Property appraisal characteristics, such as land use or ownership can be applied at the parcel level.
Figures


Accuracy Assessment
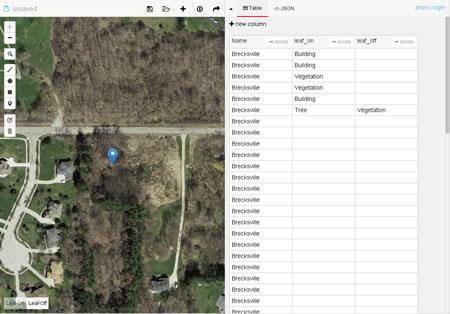
In order to determine the accuracy of the land cover products, a rigorous accuracy assessment was conducted. Over 1,900 points were sampled and evaluated using a web-based mapping application developed by Cleveland Metroparks. Both the 10-class land cover and 7-class land cover data sets were evaluated for accuracy.
Overall, the land cover data proved to be about 93% accurate. The accuracy of the “Tree Canopy” classification (the basis for metrics reported in the study), was found to be greater than 97%.
Per-Class Accuracy Assessment*
| Class | Accuracy (%) | +/- (%) |
|---|---|---|
| Vegetation/Soil | 88.8 | 2.4 |
| Building | 97.6 | 2.1 |
| Road/Other Pavement | 95.2 | 2.5 |
| All Tree Canopy | 97.8 | 1.5 |
| Water | 83.3 | 15 |
* The 7-class land cover scheme was consolidated to 5 classes for accuracy assessment. “Vegetation” was combined with the relatively rare “Bare Soil” class. In addition, “Road/Railroad Pavement” and “Other Pavement” were combined for the accuracy assessment.
Thanks to many of the participating communities that assisted in conducting the accuracy assessment. In addition to the Cuyahoga County Planning Commission and Cleveland Metroparks, assessments were conducted by:
- Bratenahl
- Brook Park
- Cleveland Heights
- Euclid
- Garfield Heights
- Highland Heights
- Lakewood
- Middleburg Heights
- Olmsted Township
- Orange
- Richmond Heights
- Rocky River
- Seven Hills
- South Euclid
- Strongsville
- Cuyahoga County Soil & Water Conservation District
Specific questions regarding this accuracy assessment can be directed to Stephen Mather of Cleveland Metroparks.
Full Reports
Two reports were prepared as part of the assessment. The University of Vermont’s Spatial Analysis Laboratory conducted and documented the land cover analysis, and County Planning wrote a summary report on the Urban Tree Canopy metrics.

